
Introduction
Many beginners enter the stock market with one common confusion—how do people predict price movements using charts? While some rely on news or tips, others use a structured method called technical analysis.
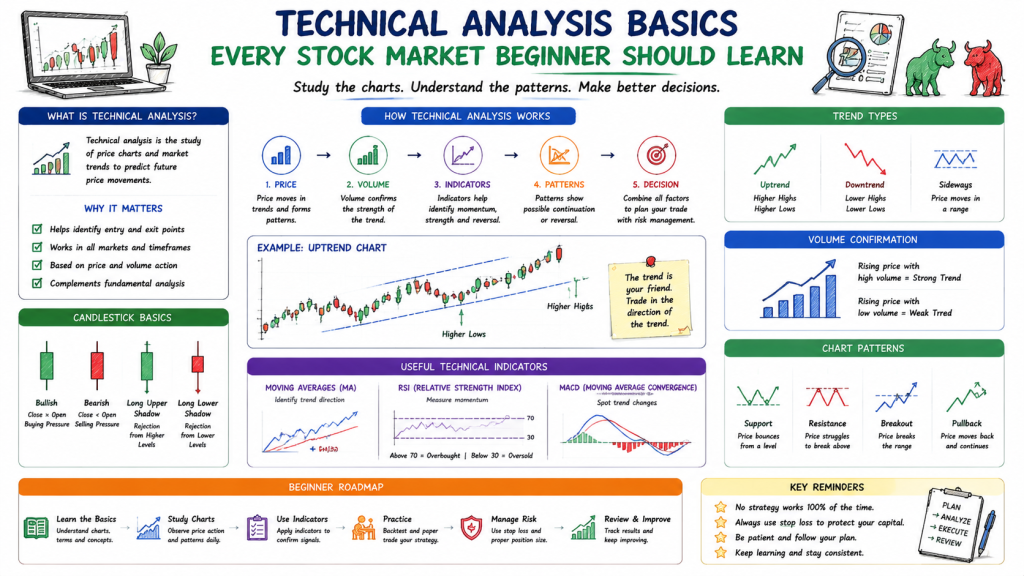
Technical analysis basics help beginners understand how stock prices move, why trends form, and how market psychology affects buying and selling decisions. It is one of the most important parts of stock market education and plays a key role in understanding short-term market behavior.
Before learning advanced strategies, every beginner should understand these core concepts clearly and simply.
For more beginner-friendly learning, you can explore:
👉 https://www.stocksmantra.com/
What Is Technical Analysis?
Technical analysis is the study of stock price movements using charts, patterns, and historical data.
Instead of focusing on company profits or business models, technical analysis focuses on:
- Price movement
- Market trends
- Trading volume
- Investor behavior
It assumes that all known information is already reflected in the price of a stock.
Why Technical Analysis Is Important for Beginners
Understanding technical analysis helps beginners:
- Identify market trends early
- Understand entry and exit points
- Reduce emotional trading decisions
- Improve timing in buying and selling
- Study market psychology
It does not guarantee profits, but it improves decision-making in trading and investing.
Technical Analysis Basics Every Beginner Should Know
1. What Is a Stock Chart?
A stock chart shows how the price of a stock moves over time.
Common types:
- Line chart
- Bar chart
- Candlestick chart
Candlestick charts are the most widely used in modern trading.
2. What Is a Trend?
A trend shows the direction of the market.
Types of trends:
- Uptrend (prices moving upward)
- Downtrend (prices moving downward)
- Sideways trend (no clear direction)
Understanding trends helps beginners avoid wrong entry points.
3. What Is Support?
Support is a price level where a stock tends to stop falling.
It happens because buyers enter the market at that level.
Think of it as a “floor” for the price.
4. What Is Resistance?
Resistance is a price level where a stock tends to stop rising.
It happens because sellers dominate at that level.
Think of it as a “ceiling” for the price.
5. What Is Volume?
Volume shows how many shares are being traded.
- High volume = strong interest
- Low volume = weak interest
Volume helps confirm price movements.
6. What Are Candlestick Patterns?
Candlestick patterns show market emotions like fear and greed.
Each candlestick shows:
- Opening price
- Closing price
- High and low price
Common patterns include:
- Doji
- Hammer
- Engulfing pattern
7. What Are Moving Averages?
Moving averages help smooth price data to identify trends.
Types:
- Short-term moving average
- Long-term moving average
They help beginners understand market direction clearly.
Simple Stock Market Analysis Using Technical Tools
Technical analysis is not just one tool—it is a combination of methods such as:
- Chart reading
- Trend identification
- Support and resistance analysis
- Indicator study
- Volume analysis
When used together, they help build a clearer market picture.
Technical Analysis vs Fundamental Analysis
| Factor | Technical Analysis | Fundamental Analysis |
|---|---|---|
| Focus | Price movement | Company performance |
| Data Used | Charts & patterns | Financial reports |
| Timeframe | Short to medium term | Long term |
| Purpose | Market timing | Business valuation |
| Best For | Traders | Investors |
Both are important parts of complete stock market education.
How Beginners Should Learn Technical Analysis Step by Step
A simple learning path:
- Learn basic chart reading
- Understand trends
- Study support and resistance
- Learn candlestick basics
- Understand volume
- Practice with real charts
- Learn simple indicators
- Observe market behavior daily
- Avoid overcomplicated strategies
- Focus on consistency and discipline
Stock Market Research with Technical Analysis
Beginners should combine technical analysis with research:
- Check market news impact
- Study stock movement history
- Observe sector trends
- Compare similar stocks
- Avoid emotional trading decisions
Technical analysis becomes powerful only when used with proper research.
IPO Analysis and Technical Basics
While IPOs are usually analyzed fundamentally, technical analysis can help after listing:
- Understand early price movement
- Identify demand and supply zones
- Avoid emotional buying during hype
- Observe stabilization patterns
IPO trading should always be approached carefully.
Common Mistakes Beginners Make in Technical Analysis
- Relying on one indicator only
- Ignoring market trends
- Overtrading based on charts
- Not understanding risk
- Expecting perfect predictions
- Following random strategies online
Technical analysis is about probability, not certainty.
How Stocks Mantra Helps Beginners Learn Technical Analysis
Platforms like StocksMantra.com help beginners understand:
- Stock market basics
- Technical analysis fundamentals
- Chart reading techniques
- Market behavior insights
- IPO and stock research education
- Simple investing concepts
It focuses on making stock market education easy, structured, and beginner-friendly.
👉 https://www.stocksmantra.com/
Best Practices for Beginners
- Start with simple concepts
- Avoid complex indicators initially
- Practice on real charts
- Focus on trends, not predictions
- Keep learning consistently
- Manage risk carefully
Expert Tips for Beginners
- Always follow market trends
- Combine multiple signals before decisions
- Avoid emotional trading
- Keep stop-loss discipline
- Learn from mistakes
- Focus on long-term learning, not shortcuts
FAQs
1. What is technical analysis in stock market?
It is the study of stock price movements using charts, trends, and patterns.
2. Is technical analysis important for beginners?
Yes, it helps beginners understand market timing and price behavior.
3. What are the basics of technical analysis?
Charts, trends, support, resistance, and volume are key basics.
4. What is the difference between support and resistance?
Support is a price floor, resistance is a price ceiling.
5. Can technical analysis predict stock prices?
No, it only helps estimate probability, not guarantee outcomes.
6. What is a candlestick chart?
It is a chart that shows price movement in a visual format.
7. What is moving average in technical analysis?
It is a tool that smooths price data to identify trends.
8. Is technical analysis enough for investing?
No, it should be combined with research and risk management.
9. What is volume in stock trading?
It shows how many shares are traded in a given time period.
10. Where can I learn stock market basics?
You can start learning from educational platforms like Stocks Mantra.
Conclusion
Understanding technical analysis basics is an important step in every beginner’s stock market journey. It helps you read charts, understand trends, and make more informed decisions instead of relying on emotions or random tips.
However, it should always be combined with proper stock market education, research, and risk awareness.
For simplified learning and beginner-friendly guidance, you can explore more at:
👉 https://www.stocksmantra.com/
Final Disclaimer
This content is for educational purposes only and should not be considered financial advice.

